

Project Description
During our market research, we sought inspiration for information-based applications. It was extremely challenging to find relevant examples, if any. The vast majority of smart TV applications focus on media content and its presentation, rather than on the additional possibilities this platform offers, such as displaying relevant broadcast information.
Therefore, our inspiration was drawn more from dashboards in complex systems and infographics on the web/mobile. In interviews and surveys, participants were primarily asked about the statistics they desired and the issues with current displays. This helped us aim to stand out and differentiate from the existing market by providing clarity and accessible information that is currently unavailable, and in a way that is not currently implemented, both in UX and UI for similar interfaces.
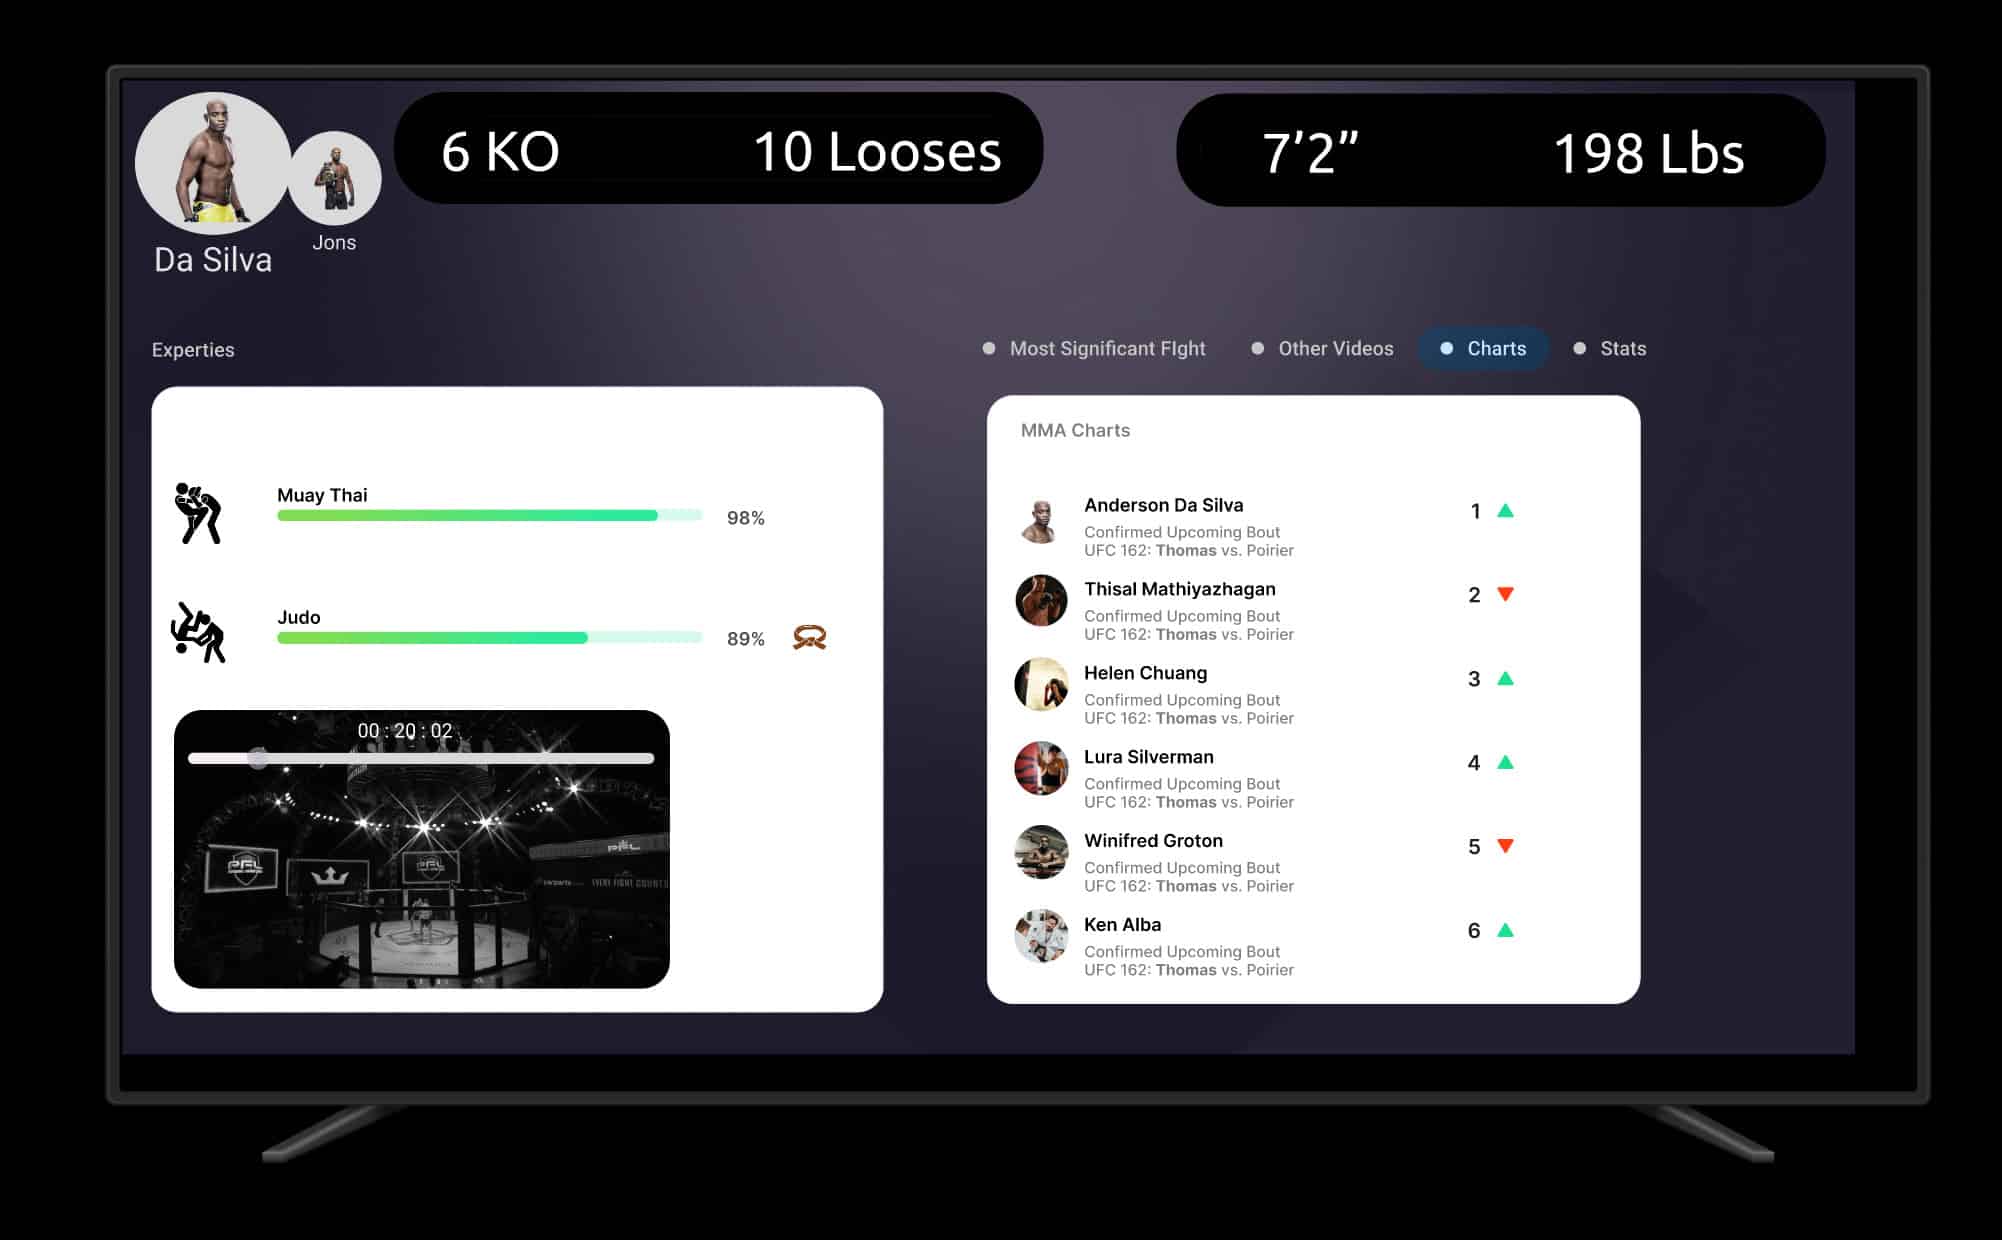
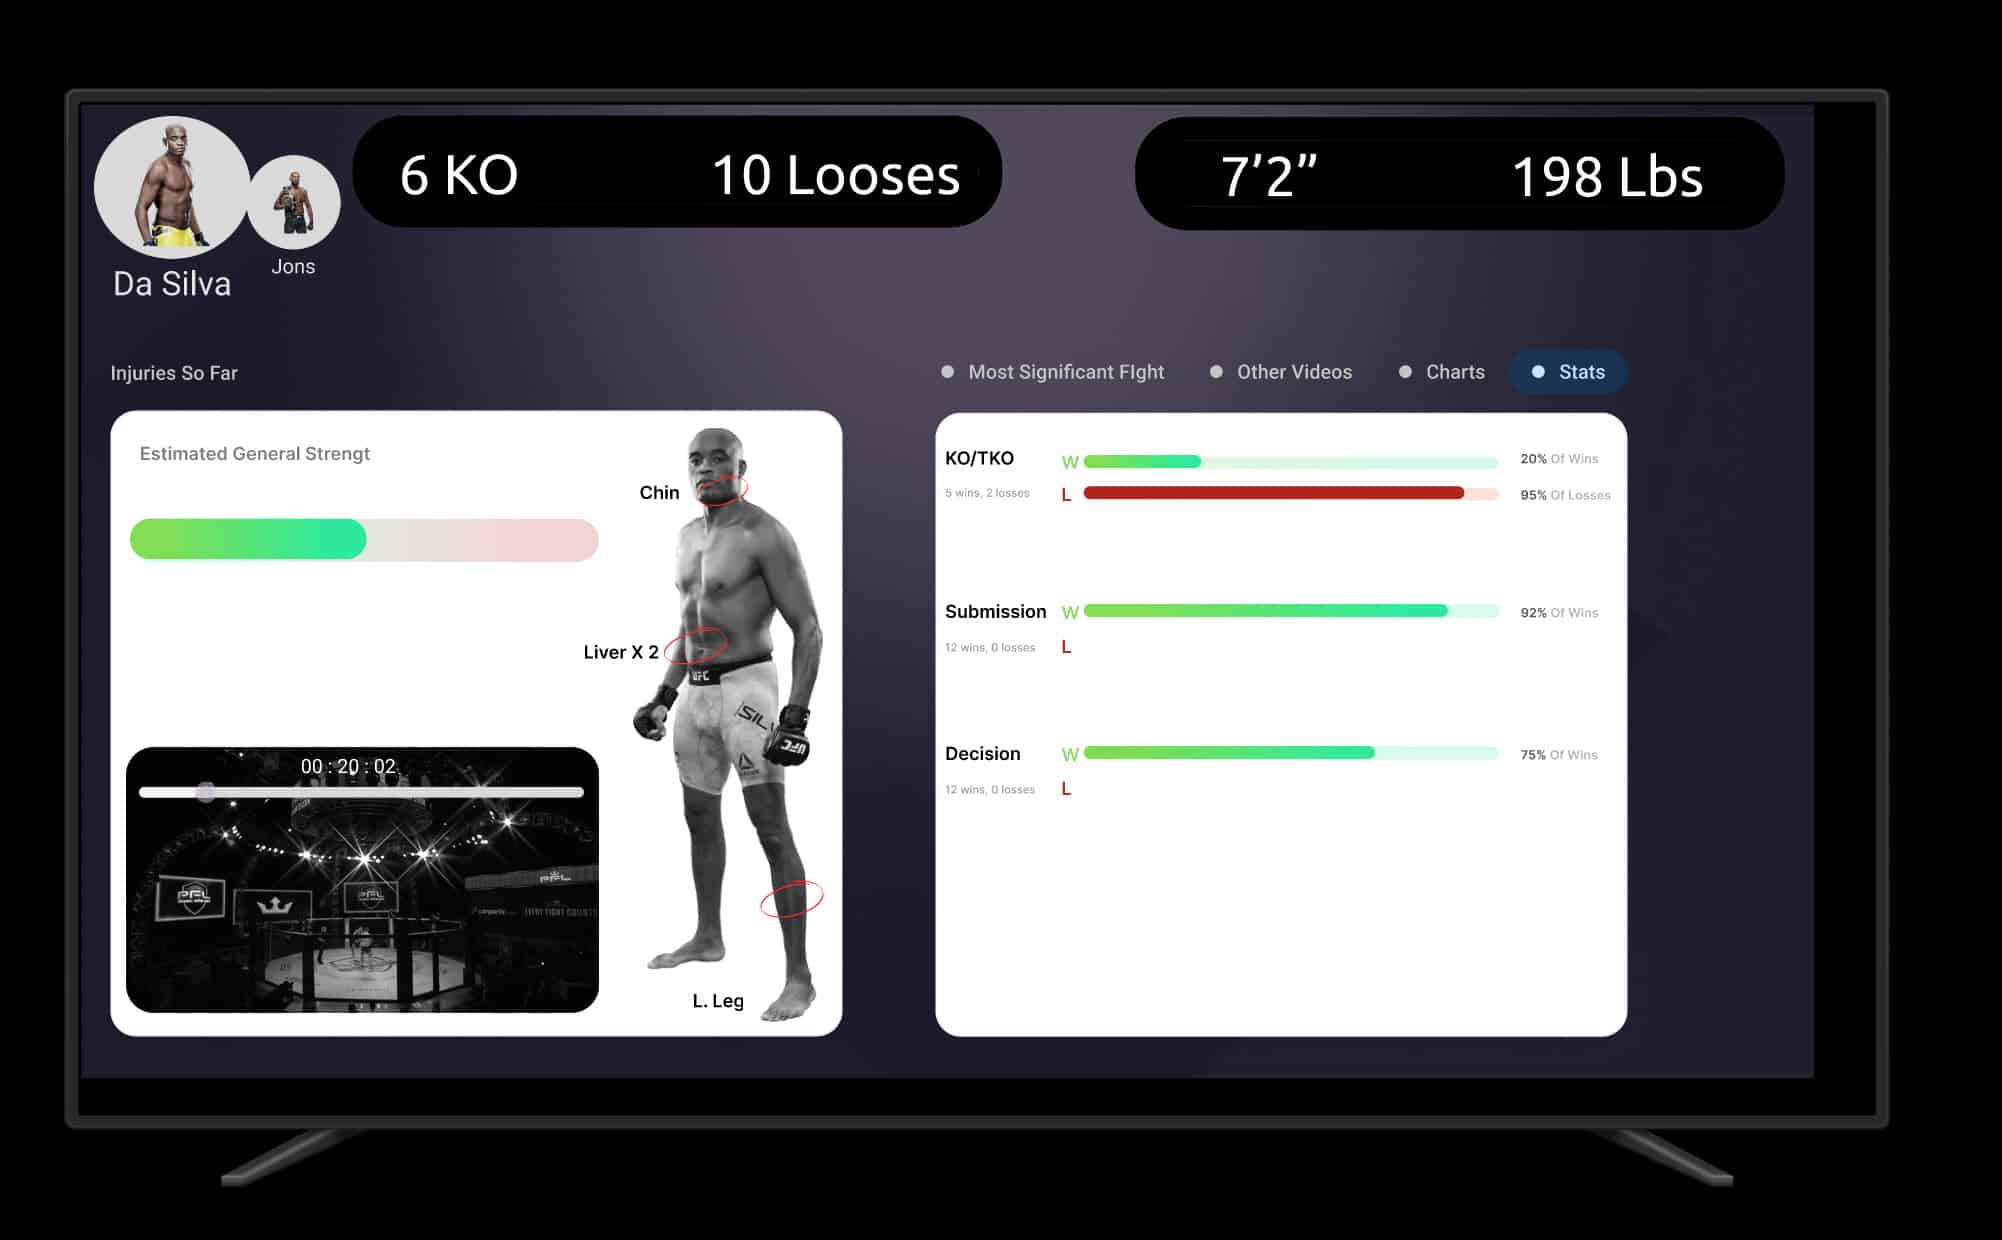
For example, regarding essential information about the fighters, we aimed to move away from the usual practice in these realms of displaying only numerical values and instead make the information more easily accessible. This approach considers that such information is consumed during a broadcast, where every minute is crucial for quick scanning and returning to the broadcast.
The methods included: reducing the live broadcast player size when choosing to display statistics; using illustrations and icons as mental models to reduce cognitive load in understanding and interpretation, such as the types of martial arts the fighter specializes in, belt color if applicable, marking injuries directly on a fighter’s illustration, and more; thinking about the information hierarchy and enriching the current information with internal data distribution models to save space.